contact
button contact

Energy Economics

It's all in the numbers. Many variables, but two main considerations: the cost to generate energy onsite and the cost of the alternative. Together, we'll navigate how to control your costs and move toward energy independence. This is an economic lesson that will pay off.

Solar Economics

The economics of energy systems boil down to two things, 1- the cost of the generation, and 2- the value of the generation.

Key Factors for Each are Listed Below:

01
Cost of Generation
  • Upfront capital cost for equipment and installation
  • The expected lifetime of the equipment
  • Annual maintenance and operation cost
  • Fuel cost (if any)
02
Value of Generation
  • The total energy output of the generator per year
  • The value of exported energy to the grid and how it is compensated (connecting utility)
Temporary Incentives
  • Tax Credits: The current investment tax credit (ITC) is 26%
  • Depreciation: Accelerated depreciation of the capital investment

Since renewables such as solar and wind do not have fuel costs, the bulk of renewable generation costs are for equipment and installation. In order to compare lifetime costs with the grid or other sources, the energy industry uses a metric known as the levelized cost of energy (LCOE). This metric represents the total expected value divided by the total expected cost over the system's lifetime.

For solar plants, the capital cost is primarily a function of the size and type of mounting or racking structure used for the solar array. Larger systems benefit from economies of scale. The most cost-effective racking solution is usually a static ground-mounted system using driven posts. Mounting the panels on a new carport is the most expensive type of mounting. Rooftop mounting structures typically fall in the middle.

Ground-mount systems are either fixed (fixed-tilt) or include mechanical systems that allow the panels to track, or follow, the sun (tracker). Fixed-tilt is less expensive and requires less maintenance, but it is also less productive.

The value of the generation is relative to the status quo—the value of the energy from the grid. It can be measured in kilowatt hours produced. But since renewable generators are intermittent, they do not always produce energy at the exact time it is needed. For example, a fixed-tilt solar system will only generate significant energy for 6–7 hours per day on average. A solar system will produce more in the summer and less in the winter due to the varying number of daylight hours and the amount of cloud cover during each season.

The economics are highly dependent on whether or not the system and energy load remain grid connected, how much of the energy is exported to the grid, and the local utility's policy on exported energy.

Given the numerous variables involved in defining both the system costs and energy value, it is difficult to provide an accurate economic assessment that can be generalized to all customers. However, we have seen that customers in California can save as much as 30% on their energy costs in the first year using solar energy and battery storage while gaining other benefits as well. We believe nearly all customers who are now getting their energy from large independently operating utilities (IOUs; e.g., SCE, PG&E) can achieve some savings on their levelized costs of energy. This is certainly true in California, and it is becoming more common throughout the US.

California Electricity Price Trends

Average retail rates, cents per kilowatthour

CA Price Trends
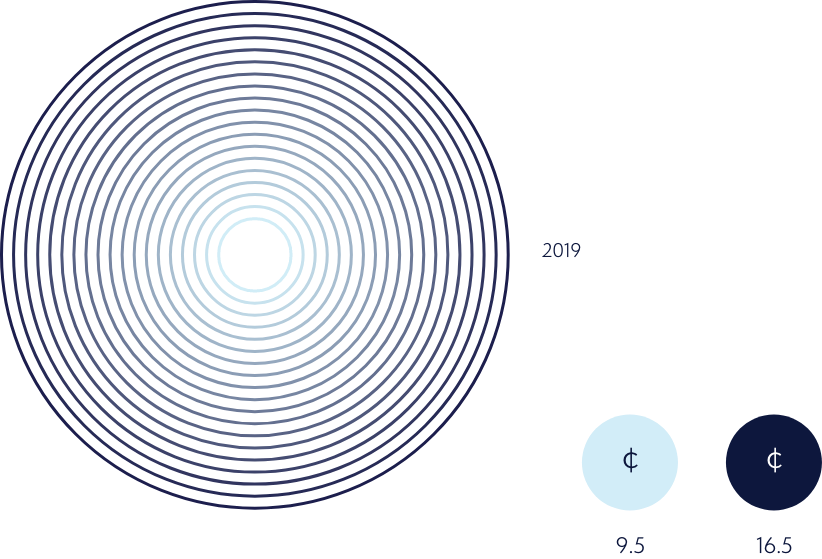
Source: U.S. Energy Information Administration Short-Term Energy Outlook, Jan 2021

Utility Costs & Trends

Over the last 20 years, the overall price of retail electricity in the US has grown substantially.

Year over year, growth in energy prices averaged only 2.2% across the United States, but a number of individual states have had alarming increases in costs. Many states in coastal regions have driven this overall growth in the nation's electricity rates by sustaining even higher energy price growth rates than the national average. For example, over the last 20 years, California has had an average yearly energy price increase of just over 3.2%, but it has accelerated in the last 10 years.

Average Retail Electricity Rates

Cents per kilowatthour

Average retail rate chart

Forecasted Value of Solar + Cost Prediction

PAC Forecasted Value

California has seen consistent retail energy prices grow particularly in two of the investor-owned utilities, SDG&E and PG&E. Both have energy rates increases that more than doubled the consumer price index rate. Fortunately, over the same time period solar prices have dropped drastically and California happens to be very sunny. Figure 04 shows a forecast of how the value of solar will continue to increase while the cost improves. Nearly every facility within the investor owned utilities territories stands to benefit from lower energy cost by installing solar energy.

Regulations

Net Energy Metering (NEM)

Net energy metering (NEM) refers to how a local utility treats on-site energy production that feeds back onto the grid, effectively spinning the energy meter backwards. There are many variations of NEM rules, but they usually include a few key elements, including 1- whether exporting energy to the grid is allowed, 2- what the reimbursement, or credit rate is for the export energy, and 3- how other non-energy charges are treated.

Connecting Renewables to Your Facilities

In California NEM rules allow exporting, and require utilities to credit customers' accounts at the full retail rate of energy for all exported energy, subject to key provisions:

  • The customer gets credited at the full retail rate up to the point where they have offset all their energy charges (but not including non-bypassable charges) as trued up on an annual basis.
  • Excess credits can roll over into the following month, however the credits and energy charges must be trued up on an annual basis.
  • After they have offset all their energy charges, they will only be credited at the wholesale rate for energy (typically far less than the retail rate, between $0.03-$0.05).
  • There is no size limit on how big an energy system can be and still qualify for NEM.

Previously in California, there was a limit on how large an energy system could be and still qualify for NEM, and such limits are typical in other states. Some states also have caps on how many total energy systems can qualify to receive net metering. Advocacy groups are encouraging NEM rules that do not limit the sizes of systems and that credit excess energy at the full retail rate.

Many large energy users may not fully understand that they can use NEM with an energy system to save on energy costs in a variety of situations, such as highly seasonal usage or extremely consistent usage. NEM is an important rule that allows solar systems to be large enough to reach economies of scale.

Virtual Net Energy Metering (VNEM) is a variation of NEM that allows a single energy system to service multiple meters without being physically connected. The program is called "virtual" because the energy is credited to the customer's multiple meters through billing and is not shared with a physical connection. VNEM programs were intended to allow properties with multiple tenants (commercial or multifamily housing) to benefit from on-site renewable energy systems. VNEM requires that the benefiting accounts must be on the same or adjacent properties and that the properties must all be owned by the same entity. It often makes sense to consolidate an energy system into one array using VNEM rather than having multiple energy systems on a property.